P/E Ratio – Price-to-Earning Ratio Explained


What is P/E Ratio?
Price to earning ratio is a valuation ratio which tells us that “what market value’s the companies stock relative to its earnings”. Basically this metric is used to find out if stock is Overvalued or Undervalued.
How to calculate PE Ratio?
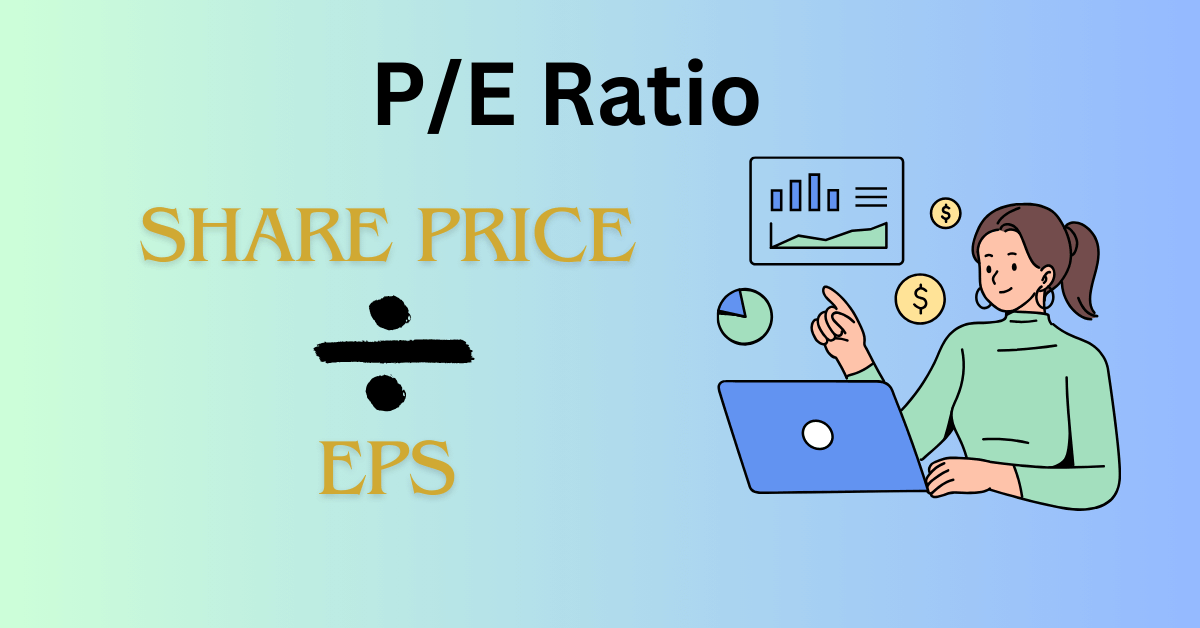
P/E Ratio is calculated by dividing market price per share of a company’s stock by its earnings per share (EPS).
How to use P/E ratio to assess the stock?
P/E is used to find out if stock is overvalued or undervalued.
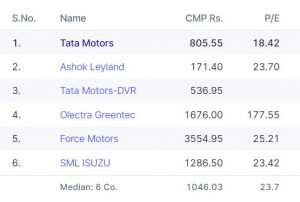
Best way to assess a stock using P/E value is by comparing it with its peers form same sector. Also one should be cautious about if P/E is high then what is the reason and if it is low then why is it low.
So you should assess overall companies growth in the past and future opportunities for the company.
What does High PE ratio means?
A higher P/E ratio may suggest that investors have higher expectations for future earnings growth.
At the same time it can also be taken as, stock is overvalued (i.e. people are paying more than the intrinsic value).
What does low P/E ratio means?
Lower P/E ratio may indicate lower growth expectations from the stock. Or we can say that a stock is undervalued. There can be many reasons for undervaluation like:
- No foreseeable growth opportunities. [-ve sign]
- Industry comparision: A stock with a lower P/E ratio than its peers may be undervalued, but it’s crucial to understand industry norms.
- Earnings Stability and Growth: Examine the company’s historical earnings stability and growth. A low P/E ratio may be justified if the company has a track record of consistent earnings growth. Conversely, declining or erratic earnings may raise concerns.
- Future Earnings Outlook: Assess the company’s future earnings prospects. If the low P/E ratio is due to expected earnings growth, it could be a positive sign. Look for factors such as new product launches, expansion into new markets, or cost-cutting initiatives.
Why some comapnies have NO P/E ratio?
If a company has zero profits or it is loosing money then there is no EPS value and hence no value to put into the denominator of formula.
Is it good if PE ratio is high?
PE ratio determines the market value of a company as compared to its earnings. If PE ratio is quite high then we can say that company is overvalued or its stock price is higher than it should actually be. This perception is based upon the previous data (Earning per share and Stock prices) or Future pridictions if we are calculating PE ratio based upon future EPS (prediction).
So we should not completely rely alon on P/E ratio.
Consider following factors while making your decision based upon P/E ratio:
- Future Expectations: High P/E generally means that market has high expectations form the company and if it doesn’t meet that, then there are higher chances of price fluctuation
- Comparision with industry: While comparing P/E ratio always compare it with its peers from same industry (Basically apples with apples). There is no fixed value of High/Low P/E, it varies from industry to industry.
- Market Conditions and Investor Sentiments: During bulish market investor might be willing to pay higher price as compared to EPS but in bearish market investors might be looking for low P/E. So for a long term investors low P/E ratio could be a good sign.
- Financial Health of Company: If you think P/E is high but company has great chances of success then you can take a bet on High P/E ratio.
- Risk Tolerance: High P/E stocks can be very volatile at times. If you have high tolerance to price changes then you can make your decision accordingly.
Is 30 a good PE ratio?
30 P/E is considered high when we compare to historical data. It is assigned to very high growing companies.

Average P/E across various sectors in India
| Industry | INDUSTRY P/E |
| Software | 27.91 |
| Oil Refineries & Marketing | 21.62 |
| Drugs & Pharma | 40.52 |
| Household & Personal Products | 58.54 |
| Life Insurance | 113.34 |
| Cement | 47.72 |
| Misc. Fin.services | 18.16 |
| Housing Finance | 2.69 |
| Telecom Services | 54.28 |
| Hire Purchase | 35.39 |
| Tobacco Products | 29.96 |
| Electricity Generation | 12.79 |
| Auto Ancillaries | 54.18 |
| Cars & Multi Utility Vehicles | 27.68 |
| Paints & Varnishes | 74.32 |
| Real Estate | 89.89 |
| Infrastructure | 29.24 |
| Finished Steel | 26.03 |
| Retailing | 101.41 |
| Two & Three Wheelers | 30.48 |
| Switching Equipment | 69.95 |
| Trading | 102.23 |
| Gems, Jewellery & Accessories | 73.04 |
| Electricity Distribution | 39.61 |
| E-Commerce | 50.02 |
| Commercial Vehicles | 84.86 |
| Power Projects | 120.1 |
| Dairy products | 87.27 |
| Non-Ferrous Metal | 12.9 |
| Misc.Chem. | 79.97 |
| Natural Gas Utilities | 47.65 |
| Health Services | 70.41 |
| Oil & Gas Exploration | 5.62 |
| Food Processing | 43.8 |
| Organic Chemicals | 55.2 |
| Marine Port Services | 31.11 |
| Diversified | 36.39 |
| Defence & Aerospace | 25.66 |
| Pesticides | 39.24 |
| Coal & Lignite | 5.03 |
| Tyres & Tubes | 40.19 |
| Bakery & Milling Prod. | 52.78 |
| Vegetable oils | 68.72 |
| Plastic Tubes & Pipes | 68.64 |
| General Insurance | 37.85 |
| SIDCs/SFCs | 3.74 |
| Aluminium | 8.09 |
| Ball Bearings | 53.48 |
| Electrical Machinery | 44.75 |
| Construction | -93.12 |
| Investment Services | 19.26 |
| Hotels | 61 |
| Air Transport | -31.7 |
| Steel Tubes & Pipes | 33.49 |
| Communication Equipment | -20.1 |
| Equipment Leasing | 19.13 |
| Sponge Iron | -0.68 |
| Electronic Equipment | 15.53 |
| Liquors | 53.12 |
| Restaurants | 73.19 |
| Wires & cables | 32.11 |
| Electronic Components | 99.83 |
| Footwear | 90.44 |
| Asset Management Companies | 26.01 |
| Industrial Machinery | 82.4 |
| ACs & Refrigerators | 95.67 |
| Media & Entertainment | 59.68 |
| Logistics | 31.9 |
| Kitchenware & Appliances | 0.37 |
| Travel & Tourism | 93.53 |
| Castings & Forgings | -282.58 |
| Diesel Engines | 42.17 |
| Other Fertilisers | 26.19 |
| Cotton & Blended Yarn | 22.77 |
| Inorganic Chem. | 15.35 |
| Readymade Garments | 51.73 |
| Packaging & Containers | 39.18 |
| Courier Services | -1.5 |
| Minerals | 191.65 |
| Abrasives | 61.75 |
| Sugar | -10.47 |
| Misc.Other Services | 21.98 |
| Brokerage Services | 16.81 |
| DFIs | 5.18 |
| Pumps & Compressors | 51.23 |
| Soyabean Prod. | 735.25 |
| Textile Processing | 75.27 |
| Beer | 124.55 |
| Other Machinery | 44.24 |
| Indl.Gases | 88.89 |
| Ceramic tiles | 53.16 |
| Ship Building | 24.29 |
| Nitrogenous Fertilizer. | 6.79 |
| Cloth | 47.21 |
| Explosives | 44.43 |
| Other Metal Products | 129 |
| Stainless Steel | 13.76 |
| Credit Ratings & Information | 45.85 |
| Diagnostics Services | 64.47 |
| Storage Batteries | 23.72 |
| Refractories | 28.55 |
| Reinsurance | 5.33 |
| Dyes & Pigments | 38.48 |
| Soda Ash | 9.93 |
| Glass & Glassware | 49.58 |
| Wood | 33.69 |
| Paper | 14.77 |
| Leisure & Recreation | -4.78 |
| Other Agriculture Products | 12.62 |
| Tractors & Farm Machinery | 35.96 |
| Fasteners | 48.97 |
| Business Services | 32.28 |
| Tea & Coffee | 123.64 |
| Synthetic Yarn | 21.87 |
| Lubricants & Grease | 12.84 |
| Exchange Services | 45.36 |
| Speciality Chemicals | 39.14 |
| Shipping | 7.15 |
| Misc.Textiles | 40.77 |
| Textile Machinery | 35.78 |
| Medical Devices & Equipment | 50.82 |
| Transformers | 50.29 |
| Thermoplastics | 30.97 |
| Steel Wires | 30.95 |
| Other Plastic Products | 93.32 |
| Caustic Soda | 9.95 |
| Home Furnishings | 31.22 |
| Carbon Black | 19.34 |
| Chemical Machinery | 30.76 |
| Cement & Asbestos Products | 20.36 |
| Books & Newspapers | 12.36 |
| Other Forms-Primary Plastic | 11.32 |
| Pig Iron | 22.28 |
| Oil Cakes & Animal Feed | 28.85 |
| Commercial Complexes | 20.9 |
| Rubber & Rubber Products | 23.71 |
| Welding machinery | 48.48 |
| Other Projects | 44.6 |
| Motors & generators | -47.74 |
| Business Consultancy | 28.09 |
| Machine Tools | 48 |
| Aquaculture | 19.01 |
| Other Vehicles | 104.07 |
| Road Transport | 17.66 |
| BPO Services | 30.77 |
| Ferro Alloys | 5.17 |
| Storage & Distribn. | 19.64 |
| Plastic Resins | 41.05 |
| Structurals | 14.9 |
| Others | 76.1 |
| Clocks & Watches | 39.31 |
| Granite & Stones | 25.4 |
| Education | 297.98 |
| Other Financial Instututions | -91.01 |
| Dry Cells | 80.77 |
| Poultry & meat prod. | 33.97 |
| Plastic Films | 11.62 |
| Misc. Manuf.Articles | 37.5 |
| Crude Oil & Natural Gas | 47.18 |
| Computer Hardware | 45.7 |
| Oil & Gas Equipment & Services | 7.4 |
| Non-Metallic mineral prod. | 43.2 |
| Phosphatic Fertilisers | 13.75 |
| Offshore Drilling | 10.86 |
| Jute prod. | 12.62 |
| Chemical Extraction | 20.72 |
| Marine Foods | -41.15 |
| Edible Oil | 4.54 |
| Synthetic Fabrics | 19.76 |
| Leather Products | 21.8 |
| Aluminium Prod. | 8.18 |


